
Market Update - The Trump Effect

What has happened in markets?
US share markets fell sharply overnight, extending the volatility that began in late February amid growing concerns that tariff policy uncertainty could push the economy into recession ― something President Trump did not rule out in a recent interview.
The S&P 500 Index dropped -2.7%, now down -8.7% from it record high on 19 February, approaching the 10% threshold that defines a market correction. The tech-heavy Nasdaq Composite fell -4%, with the Magnificent 7 mega-caps ― leaders of the past two and a half year rally ― leading the declines as investor rotate into perceived safe havens like government bonds, driving bond yields lower. The VIX Index, often called the market’s "fear gauge," spiked overnight as investors reacted to heightened uncertainty. The VIX measures expected volatility in the stock market — when it rises sharply, it signals that investors are bracing for bigger market swings ahead.
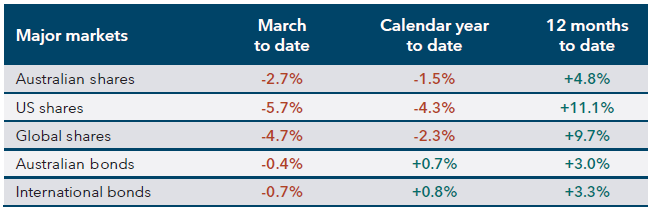
The following table shows the performance of major investment markets since the beginning of March, calendar year-to-date, and over the past 12 months (as of 10 March 2025):
What is causing the recent market volatility?
Since late February 2025, financial markets have been volatile, with President Trump’s shifting stance on tariffs and economic comments cited as key factors. His on-again, off-again tariff announcements on Mexico, Canada, and China fuelled uncertainty. Then, overnight, he warned the US economy might face "short-term pain" and didn’t rule out a recession, adding to market jitters. These developments have contributed to sharp fluctuations in asset prices.
Secondly, the impact of market uncertainty is being compounded by a starting point of stretched valuations. The strong rally in share markets over 2023 and 2024, driven by high optimism on future earnings growth, pushed equity valuations to elevated levels, particularly in sectors linked to artificial intelligence and US mega-caps. With valuations at these extended levels, markets have become increasingly vulnerable to any emerging uncertainty around future growth expectations. The unwinding of these stretched valuations explains why the stocks, sectors, and regions that led the rally in recent years are now leading the latest sell-off.
The S&P 500 surged more than 20% in both 2023 and 2024, but such rapid gains can leave markets prone to corrections. Some analysts argue that recent volatility is less about current events and more a natural rebalancing following a period of exuberant gains.
What are we doing in response?
We understand short-term market volatility can be unsettling. However, it is important to keep in mind that volatility is a normal and expected part of investing. While we will continue to monitor the situation closely, we do not believe this is the time to make changes to portfolios or your long-term strategy. Your investment strategy has been tailored specifically to meet your individual circumstances, goals, and objectives. By utilising well-diversified portfolios with the right mix of assets and high-quality fund managers, we ensure your strategy remains on track and can navigate these periods of market volatility.
Market declines are common but never last
Market declines are more common than most people might think. The table below shows how frequent intra-year declines have been in the Australian share market over the past 7 years. On only one occasion during this period did the market avoid a negative daily move of more than -1% (1959). Pullbacks of 5% are very common, occurring on average every 1.2 years. Market corrections — defined as a fall in an index of greater than 10% but less than 20% — have happened in just over half of the years and, on average, are expected to occur every two years. While investors should on average expect to experience a bear market in Australian shares — a fall in an index of 20% or greater — every 7.3 years.
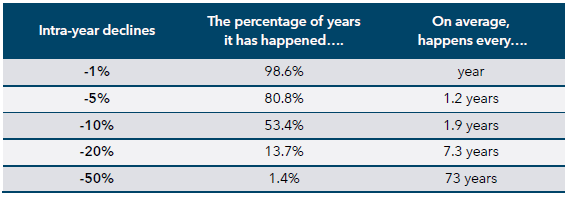
Source: Morningstar/Evidentia. S&P/ASX All Ordinaries TR Index since 1955.
All financial services included in this communication are authorised by Infinity Financial Consultants, Infinity Financial Consultants Pty Ltd is a Corporate Authorised Representative of Infinity Advisor Australia Pty Ltd ABN 53 636 060 609 AFSL No. 519295. It is general information only and does not constitute financial product advice. If any statements made (either alone or together) constitute advice, then the advice is general advice only and does not take into account anyone’s objectives, financial situation or needs. This document is based on information considered to be reliable. It is based on our judgement at the time of issue and is subject to change. No representation, warranty or undertaking is given or made in relation to the accuracy or completeness of the information presented in this document. Except for liability that cannot be excluded, Infinity Financial Consultants, its directors, employees, agents, and related bodies corporate disclaim all liability in respect of any error or inaccuracy in, or omission from, this document and any person’s reliance on it. This material is not intended for distribution to, or use by, any person or entity in any jurisdiction or country where such distribution or use would be contrary to local law or regulation. If this document contains any performance data, then performance is not a reliable indicator of future performance.